The Fall Turnover and “Ice-In”
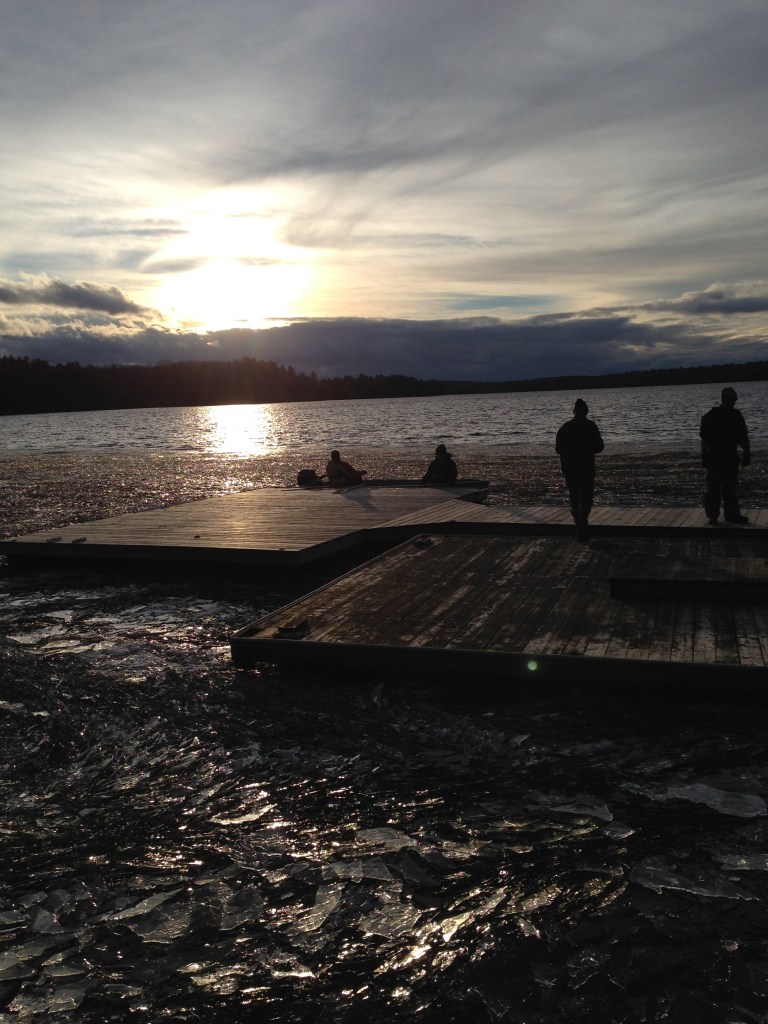
Rounding up a wayward dock, Dec 29, 2014
Two key things to know are that water is densest at 4 degC, and that during the cooling of the lake in the fall this causes a mixing to occur wherein oxygen rich surface water is transported to the depths of the lake, thereby replenishing the oxygen that is continually consumed by respiration and decomposition.
The variables that affect “ice in” are a bit different that those that affect “ice out”. In order to freeze, the lake must cool down, and thus heat must be extracted until the water column is at 4 degC (where water is the densest). Before then, as top water is cooled, its density increases and thus it falls to where the water below it is also at 4 deg C. As it falls, warmer water rises, and it then undergoes cooling. Once the entire column is at 4 degC, then ambient cooling can begin lowering the temperature of the top water. This “almost frozen” water is lighter than the 4 degC water so it does not fall and continues to give up heat until eventually sufficient heat is extracted that it undergoes a phase change to ice at 0 degC. Again, ice is lighter than water, and so it stays at the surface.
The lake water below the ice continues to freeze (“black ice”) so long as heat can be extracted below the already formed ice. Ice thickness is also added to by the freezing of snow and water above the ice (“white ice”). The speed and depth of ice formation will be determined by the ambient air conditions and the amount of snow cover (an insulator). Another factor, though I’m not sure how big it is, is that Chandos is fed by springs, and this heat input likely retards the ice from coming in.
Thus the major variables for determining when the lake will freeze are the amount of heat in the lake that needs to be extracted; the rate at which it can be extracted; and when the onset of winter actually occurs. The amount of heat in the lake can be expressed by the average temperature. Thus a warmer summer usually means that the ice will come in later.
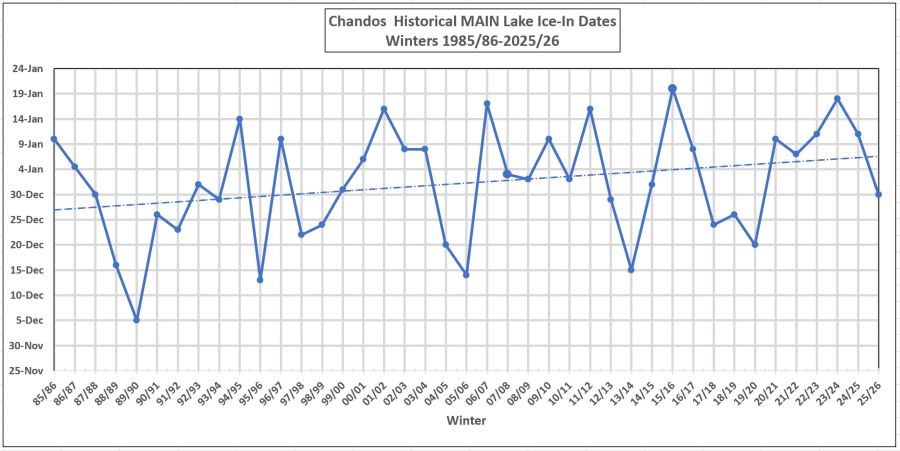
Here is the latest graph for “Ice-In” that includes the data point of December 30 for 2025/26. The ice came in early this year, The data is from Cathy Burgess. The trend line is a likely indicator of global warming. Over Cathy’s 40 years of observation, the “ice In” trended date has moved out about 11 days, from Dec 26 to Jan 6.
There will always be a bit of flash freezing of the surface, when it gets frigid enough to cool the surface water faster than it is being warmed from below, But, as described above, in order for the lake to seriously freeze, the overall temperature top to bottom of the lake needs to be about 4 degC, which is when the water density is at its maximum. (and of course, the air temp must be below freezing) At this point as the water in contact with the ice begins to cool, it will be lighter than the water below and will cool to a solid state.
Determination of Ice-In
The ice does not come in magically over the entire lake all at once. Shallow bays, including Gilmour Bay, freeze over a lot earlier than the main lake. Areas at the north end of the lake close to the culverts may never completely freeze, due to the flowing water. Some years the ice comes in fits and starts: it sort of forms, but then winds, wave, warmer weather and/or rain force a retreat. 2022 was like this. It was hard to know when the ice actually came in because it would almost form but then warm weather would delay it. Cathy Burgess has been diligently tracking the ice since 1985, with the same basic method, Her home is at the south end of the main lake with a good view up to the beach. Using binoculars she scans the lake and decides whether or not the “ice is in”. She also checks with various folk around the lake. The methodology may not be completely foolproof every year, but it is consistent, and consistency is important in order to see the trends.
The Spring Turnover and “Ice-Out”
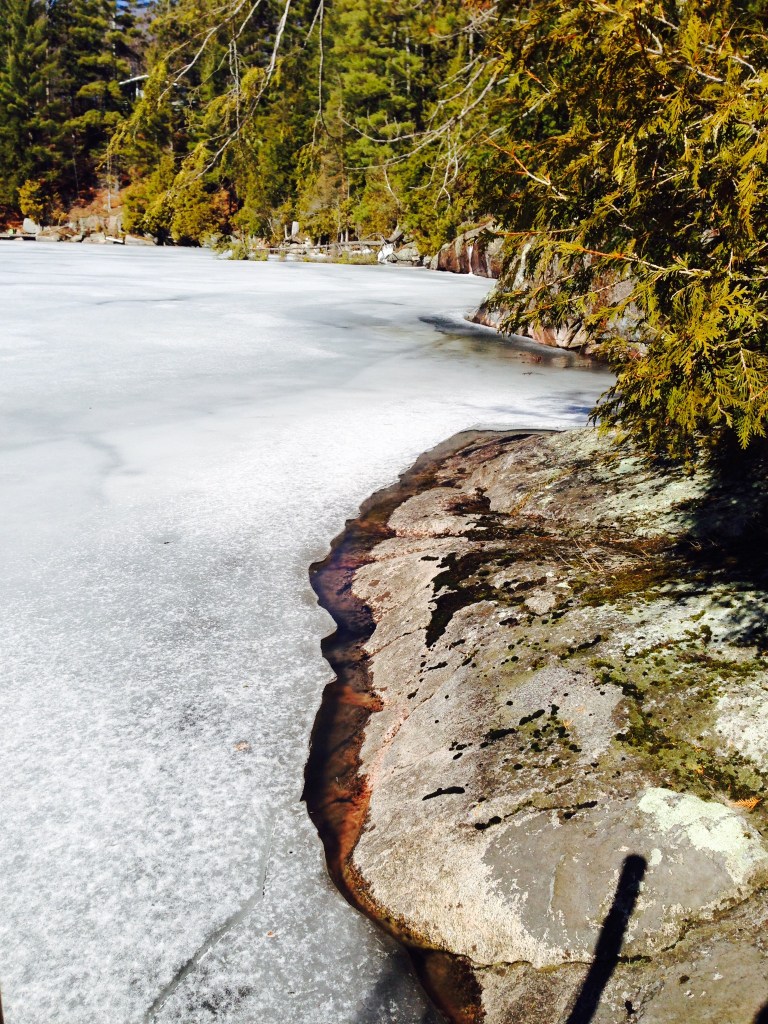
Spring is on its way!
Once the ice is out, the lake has a slight temperature gradient, going from 0 deg at the surface to 4 degC at the bottom . As the surface of the water warms to 4 degC, (where water has maximum density), the surface waters fall, and a turnover similar to that in the fall will occur. This mixing due to vertical density differences is weaker than that of the fall turnover. Mixing is further aided by natural heat exchange due to temperature differences and also due to wind action. Particularly if there is a good fetch, the wind will push the water towards the far shore, which will create an upwelling condition at the near shore, thus creating a circulating current. (As an aside, along lake Erie, which runs west to east, storm and wind surges and seiches can create several feet of difference in water elevation from one end to the other! This can rapidly bring cold oxygen depleted water up from the depths, possibly resulting in fish kills.)
After a while, and as warming continues, stratification of the lake sets up, and mixing between the epilimnion and hypolimnion layers ceases.
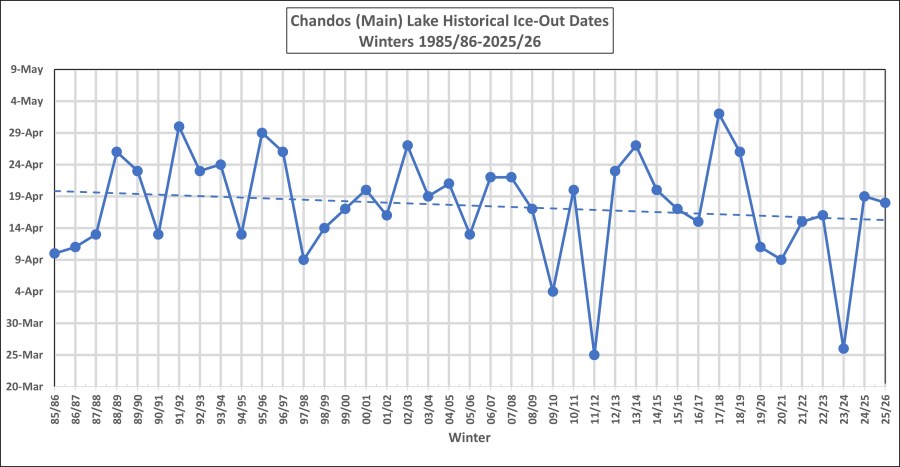
Below is the graph for Ice-Out from the winter of 1985/86 to 2025/26. It is courtesy of Cathy Burgess. The Ice-Out date for 2026 is April 18.
The earliest it has been in recent times is 25 March 2012, and the latest is 2 May 2018.
Cathy establishes the dates by looking up the main lake to the beach. Usually this is the last ice to leave, but occasionally, ice can be blown into certain bays where it piles up and can hang around for a little bit longer. Areas where the snow cover in the spring is greater than on the main lake can also slow down the thaw in those areas. But in order to be consistent she is guided by what is happening on the main lake. It may well be that others note a slightly different date, based on their observation point. In 2015 there were several different Ice-Out reports, and there is a wee discussion in this blog post on the subject.
Special notes:
2024 and 2025 are asterisked years!
The ice in the main lake went out much earlier than that in some of the protected and shallower bays, which in some cases took an extra week. This presented a lot of consternation, because a significant amount of ice was actually still on the lake overall. However, in order to be consistent with all the previously collected data, we have to stick with the method of just evaluating the main lake ice. In general, with all else being relatively equal, the deeper waters will freeze up last in the fall and also lose their ice later in the spring. So the main lake normally is a good indicator of the lake being ice free.
Ice-Cover
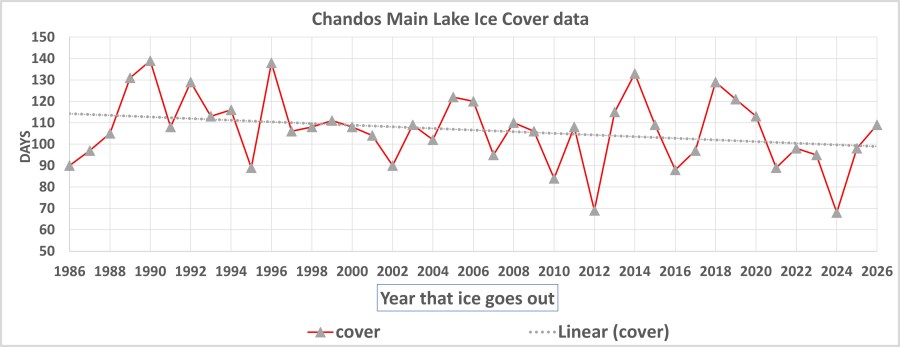
- In 2025/26 the lake had ice cover for 109 days, up from 98 days in 24/25, and from 68 days in 23/24. Please see the blog post at https://chandossier.com/2022/04/20/when-is-the-ice-really-out/
for further discussion.
-1989/90 holds the record with 139 days. (Dec 5- 23 April).
-The Ice-Cover has been decreasing by about 4 days per decade.
